
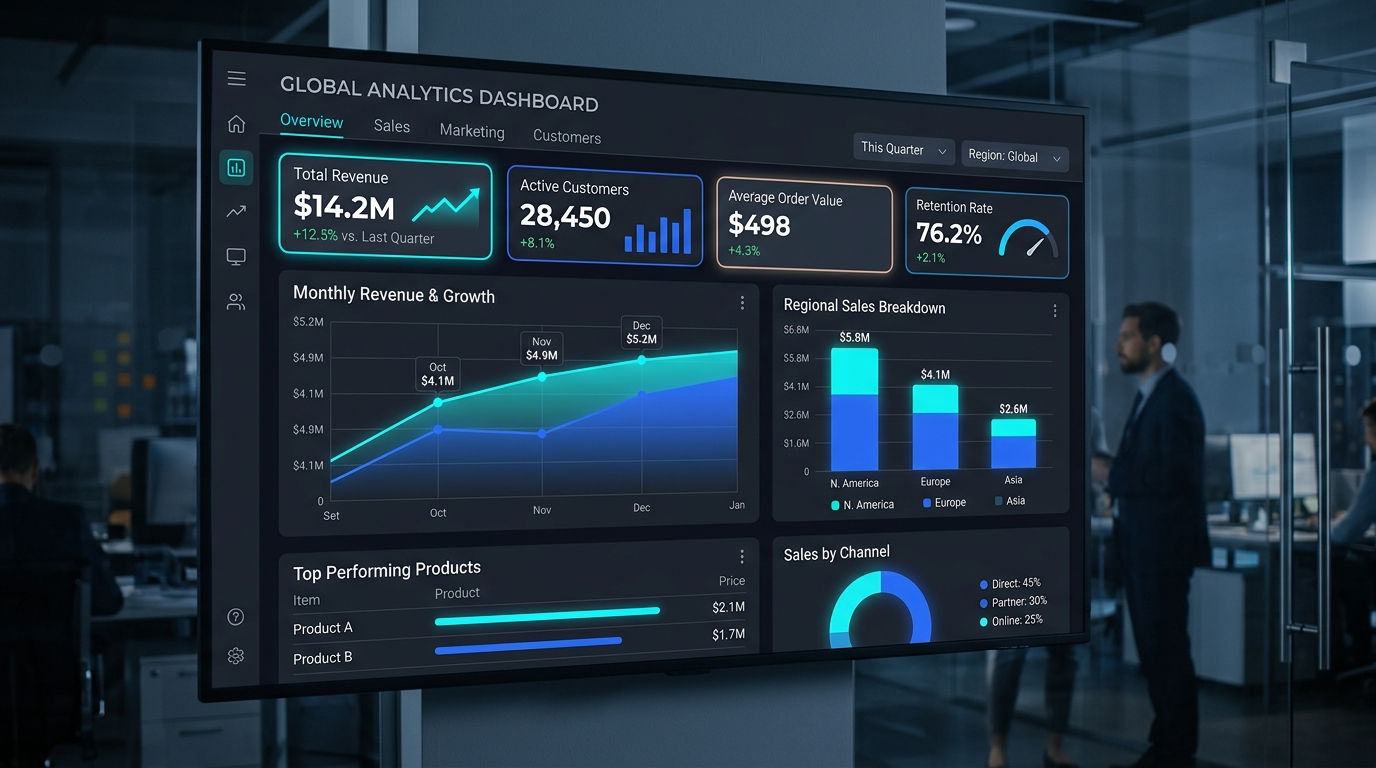
Across the enterprise technology landscape, millions of dollars are invested in business intelligence platforms — Power BI, Tableau, Looker, and Metabase. Yet within six weeks of launch, an alarming percentage of corporate dashboards become ghost towns. Business operators bypass the shiny analytics portal and return to requesting raw CSV exports in their email inboxes.
Why does this happen? The problem is almost never the underlying data pipeline or the charting library. The failure is architectural: dashboards are built to showcase everything that can be measured instead of answering decisions that must be made.
The 5-Second Executive Rule
When a CEO, department head, or operations manager opens a report, they are not looking to explore an interactive playground. They are trying to answer two immediate questions within five seconds:
- Is the business healthy right now? (Green or red?)
- If something is broken, where do I direct attention? (Root cause)
If your dashboard forces users to click four slicers, drill through three sub-menus, and decode a 3D radar chart before they understand whether revenue is on target, they will never make it a habit.
The Core Metric: If an executive cannot summarize current status and trajectory from your dashboard in under five seconds without touching the mouse, the layout has failed its primary objective.
Structure by Hierarchy: The F-Pattern Layout
Human eyes scan operational dashboards in a disciplined visual hierarchy. Great report design places the most critical, summarized information where gaze naturally starts, reserving granular investigative tables for the lower sections.
[ Top Row: Headline KPI Scorecards ]
| ARR: $2.4M (+14%) | Churn: 1.8% (-0.3%) | CAC Payback: 7.2 Mo | Net Margin: 28% |

[ Middle Row: Trend Context & Trajectory ]
| 12-Month Rolling Revenue vs Budget (Line) | Pipeline Stage Conversion Funnel (Bar) |

[ Bottom Row: Operational Action List ]
| Accounts at Risk (>14 Days Dormant) | Top Expiring Contracts This Month |
Eliminating Chart Bloat: What to Remove
Most reporting overhauls do not require adding visualizations; they require rigorous pruning. Here is what we recommend removing immediately:
- Gauge / Speedometer Charts: They occupy vast screen real estate, provide zero historical context, and communicate less information than a single text metric with a sparkline.
- Pie Charts with more than 3 slices: Human brains struggle to compare angles. Replace them with sorted horizontal bar charts where differences are instantly discernible.
- Decorative 3D effects and dual axes: 3D distortion obscures actual coordinates. Dual axes frequently trick viewers into inferring false causal correlations.
- Raw data tables without conditional formatting: A table of 500 rows is not an executive dashboard; it is a database dump. Highlight exceptions, thresholds, and outliers.
Deliver Context, Not Just Raw Numbers
A metric in isolation is devoid of meaning. If your dashboard displays "Inbound Leads: 420", is that exceptional or alarming? Stakeholders must immediately know the comparison anchor:
- Comparison vs Target:
420 / 500 (84% of quota) - Comparison vs Prior Period:
420 (+12% vs last month) - Trend Direction: A compact 7-day sparkline indicating momentum.
Summary: Build for Decision Velocity
The measure of a successful dashboard is not its complexity or the number of filters it contains. The true metric of quality is how rapidly and confidently it enables stakeholders to take decisive action. Start with the decisions, work backward to the metrics, and strip away everything that does not illuminate the next step.